Representing Change with Energy Pie Chart
Why do we need to use another representation?
This reading describes the second tool we use to help represent systems: Energy Pie Charts. Energy Pie Charts are designed to show how energy is stored at different stages during a process or change. Most often we will look at the stages before (“initial”) and after (“final”) an event occurs, but sometimes, on quizzes for example, we look at diagrams for intermediate stages as well.
The key to successful use of these charts is to pay close attention to the “system”. Before doing an energy analysis of the situation you must decide (or you will be told), which components comprise the system of interest, and which are outside of the system a.k.a. the “surroundings”. In the first reading, we called this “defining the system”. How you define the system will determine how energy storage and transfer are represented and whether they occur within the system or whether energy enters or leaves the system.
In general, the more components you include in the system, the simpler the analysis will be. In this case energy is transferred between the storage modes internally. This is helpful in situations involving friction. The fewer components included in the system, the more complicated the analysis because you must account for energy transfer into or out of the system, across the system boundary. So, if given a choice, you may want to include all relevant (interacting) elements within the system.
Guiding questions to help with energy storage analysis:
1. What is the system?
2. Where is the energy coming from? (Where was it stored prior to the event?)
3. Where does the energy go? (Where is it stored after the event?)
Using Energy Pie Charts:
1. Energy Pie Charts qualitatively represent changes in how energy is stored within a system as the system undergoes an event or process. Since pie charts are usually used to represent the parts of a “whole,” remember to include any surfaces that cause friction in your system. Used this way, pie charts readily represent the storage of Energy in a qualitative way.
The energy notation used in the Energy Pie Charts should be an “E” with a subscript that identifies the energy storage. As discussed in our Activity 1 Energy Stations, energy storage modes will generally include:
Energy stored in Movement:
Energy stored in Position or Arrangement:
3. Sometimes during a change, some energy is no longer usable, or easily measurable, or fully recoverable. This energy is stored in the system internally, and we label this Eint. Internal energy is not “lost”. The energy is stored in the rearrangement of the system and/or in the random motion of microscopic particles that occurs when two surface rub against one another. The energy just cannot be transferred back into another storage mode.
Consider if energy can be “recovered” in a process to determine whether there is Eint involved. In general, when Energy is stored as Eint, it is stuck there for good. To make an analogy between Eint and money, it is like the service charges that a bank imposes on a credit card transaction - that money is still within the system that includes your account and the bank, but it is lost from your account, never to be recovered! Can you think of an example of energy stored in Eint at the end of one of our Activity 1 Energy Stations?
4. And a final note about representing energy: we write “E” with a subscript, as opposed to symbolizing it as KE, or GPE, CPE or EPE as you may see in a physics text book, for a reason. We want to emphasize that all energy is the same, all energy is energy, no matter how the energy is stored. The “E” with a subscript notation represents modes of energy storage, rather than discussing “types” of energy.
This reading describes the second tool we use to help represent systems: Energy Pie Charts. Energy Pie Charts are designed to show how energy is stored at different stages during a process or change. Most often we will look at the stages before (“initial”) and after (“final”) an event occurs, but sometimes, on quizzes for example, we look at diagrams for intermediate stages as well.
The key to successful use of these charts is to pay close attention to the “system”. Before doing an energy analysis of the situation you must decide (or you will be told), which components comprise the system of interest, and which are outside of the system a.k.a. the “surroundings”. In the first reading, we called this “defining the system”. How you define the system will determine how energy storage and transfer are represented and whether they occur within the system or whether energy enters or leaves the system.
In general, the more components you include in the system, the simpler the analysis will be. In this case energy is transferred between the storage modes internally. This is helpful in situations involving friction. The fewer components included in the system, the more complicated the analysis because you must account for energy transfer into or out of the system, across the system boundary. So, if given a choice, you may want to include all relevant (interacting) elements within the system.
Guiding questions to help with energy storage analysis:
1. What is the system?
2. Where is the energy coming from? (Where was it stored prior to the event?)
3. Where does the energy go? (Where is it stored after the event?)
Using Energy Pie Charts:
1. Energy Pie Charts qualitatively represent changes in how energy is stored within a system as the system undergoes an event or process. Since pie charts are usually used to represent the parts of a “whole,” remember to include any surfaces that cause friction in your system. Used this way, pie charts readily represent the storage of Energy in a qualitative way.
The energy notation used in the Energy Pie Charts should be an “E” with a subscript that identifies the energy storage. As discussed in our Activity 1 Energy Stations, energy storage modes will generally include:
Energy stored in Movement:
- Ek: energy – kinetic, energy stored in motion of objects
- Eth: energy – thermal, energy stored in a collection of moving particles (temperature)
Energy stored in Position or Arrangement:
- Eel: energy – elastic, energy stored internally in the stretch or compression of something stretchy
- Eg: energy – gravitational, energy stored in the gravitational field between an object and in this case, the Earth
- Eph: energy – phase, energy stored in the electric field due to physical characteristic (solid, liquid, or gas)
- Ech: energy – chemical, energy stored in the electric field due to chemical bonding
3. Sometimes during a change, some energy is no longer usable, or easily measurable, or fully recoverable. This energy is stored in the system internally, and we label this Eint. Internal energy is not “lost”. The energy is stored in the rearrangement of the system and/or in the random motion of microscopic particles that occurs when two surface rub against one another. The energy just cannot be transferred back into another storage mode.
Consider if energy can be “recovered” in a process to determine whether there is Eint involved. In general, when Energy is stored as Eint, it is stuck there for good. To make an analogy between Eint and money, it is like the service charges that a bank imposes on a credit card transaction - that money is still within the system that includes your account and the bank, but it is lost from your account, never to be recovered! Can you think of an example of energy stored in Eint at the end of one of our Activity 1 Energy Stations?
4. And a final note about representing energy: we write “E” with a subscript, as opposed to symbolizing it as KE, or GPE, CPE or EPE as you may see in a physics text book, for a reason. We want to emphasize that all energy is the same, all energy is energy, no matter how the energy is stored. The “E” with a subscript notation represents modes of energy storage, rather than discussing “types” of energy.
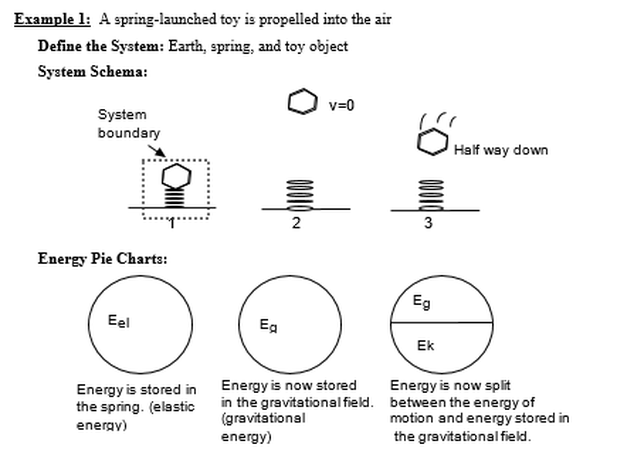

Analysis:1. It is critical to identify the system first. In this case, everything relevant is included in the system. If the spring were NOT included in the system, the toy would initially have no energy, and the spring would then transfer energy to the toy by an external force across the system boundary. This is more complex, and is difficult to represent using the pie charts, which are designed only to address internal how energy is stored, and how that storage changes during an event.
If you are given the option to choose the system yourself, identify the system so the energy remains within the system when using the pie charts. The key is to make the system as inclusive as possible. When considering an object in motion, it is recommended that the Earth always be included in the system, so that Eg can always be considered a result of an interaction between the object and the Earth. This interaction is known as the gravitational field between the Earth and the object. Eg is stored in this invisible field, which changes shape when the object’s height above the earth changes (even though we can’t see it). This is easiest to represent if both are chosen to be included in the system.
2. Notice that the sizes of the circles are all the same. Implicit in this choice is the idea that the total quantity of energy within the system remains the same throughout the event—that is, energy is conserved. If the toy were launched by a stronger spring, the circles would be larger (denoting more energy) but each would still be the same size as the other if the earth the spring and the toy were included in the system.
3. The divisions in the pie show the relative amounts of the energies. For example, if point #3 had been chosen when the toy had fallen only 1/4 of the way back down toward the earth, then only 1/4 of the circle would be Ek. The remaining 3/4 would still be Eg.
** While pie charts are qualitative representations of stored energy, the relative sizes of the slices of the pies should be drawn carefully. For example, Eint due to air resistance in most cases should probably be a tiny slice of the pie, not a large proportion. Sometimes the total energy involved in an event is so large that the Eint stored as air resistance is so small as to be safely ignored.
Analysis:
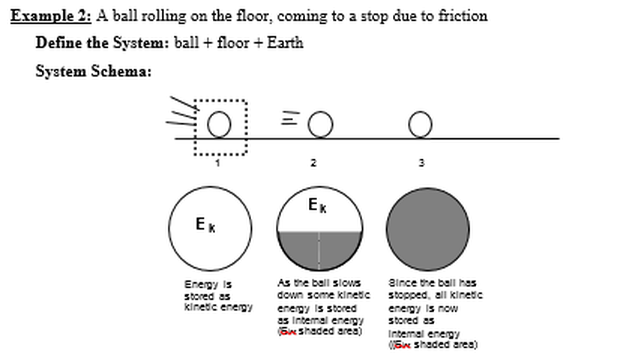
- Ek is the energy of motion.
- Eint = internal energy. It is a simple, qualitative way to account for the transfer of energy stored in the motion of the ball to another storage form. We know the energy is now in another form because of the temperature increase of the surfaces of the ball and floor. This form is termed Eint. It is shaded in to represent that the energy is no longer usable or recoverable.
- The system includes the floor to maintain the representation of conservation of energy. If the system included only the ball, the circles would have to get smaller as the energy of motion of the ball decreased and some of the internal energy left the system (the ball) via heating caused by friction to the floor.
- The Eg is not represented in this case because there is no change in height of the ball; therefore, there is no change in the amount of energy stored in the gravitational field between the ball and the Earth. (One could choose to include the same amount of Eg in each pie to signify that this storage form of energy stays constant, but in general we want to keep representations as simple as possible and one way to do this is to include only those storage modes where energy is changing).
